


Student Achievement
Student achievement is an integral part of the mission of College of Charleston. The emphasis on student success is consistent with the statutory mandates and directives of the South Carolina Department of Administration and the South Carolina Commission on Higher Education.
The College of Charleston’s mission, last reviewed and approved by the Board of Trustees May 7, 2020, states:
The College of Charleston’s Strategic Plan, Tradition and Transformation, adopted in spring 2020, identifies three areas of strategic priorities. Two of the three areas are directly related to student achievement. Strategies for achieving these goals are appropriate to the institution’s mission and reflect the College’s Goals for Measuring Student Achievement:
- Student Experience & Success. “Ensure an effective support system that increases retention (Goal 6, 7 and 10) and graduation rates (Goal 1 and 9) and enables students to learn and grow in every aspect of their college experience, preparing them to work (Goals 2 and 4) and lead in a globally connected world.
- Academic Distinction. “Become ranked as a national university distinguished by our innovative liberal arts core and high-achieving students (Goals 3,5, and 8) and alumni.
Both the College’s mission and the Strategic Plan emphasize the principles of the liberal arts. This commitment is evidenced by the common general education requirements for all students, regardless of program of study. The College honors both its liberal arts traditions and the possibility of transformation in its academic programs. Students can choose to study in the arts, science, and humanities as well as engineering, business, and education.
The College is committed to the success of every student and equity in academic achievement across diverse cohorts of students. To that end, student achievement data is disaggregated by gender, race, and other relevant socioeconomic indicators where available. Any differences in success outcomes between and among groups of students are reviewed in light of the College’s overarching goal of fostering an inclusive campus culture where all students can flourish.
The South Carolina Code of Laws describes a mission for higher education in South Carolina that would have each public university achieve goals relevant to student success, including “high academic quality” and “instructional excellence” (S.C. Code of Laws, Section 59-103-15). Critical success factors for academic quality, as specified in the Code of Laws, include graduates’ achievements based on six performance indicators: the institution’s graduation rate, employment rate for graduates, employer feedback on graduates, scores of graduates on post-undergraduate examinations and certification tests, the number of graduates who continued their education, and the credit hours earned by graduates (S.C. Code of Laws, Section 59103-30). The South Carolina Commission on Higher Education is given responsibility for “coordinating an efficient and responsive higher education system” in South Carolina, consistent with the relevant statutes.
The College’s Ten Goals for Measuring Student Achievement
The College evaluates the success of students using six performance indicators for graduates’ achievements, as designated in state law. In addition to these performance indicators, the College has evaluated the success of continuing students using four common metrics: retention rates, degrees awarded, time to degree completion, and course completion rates. These 10 goals and corresponding achievement metrics are appropriate for the College of Charleston given the institutional mission and strategic initiatives of the institution explicitly stated in the College’s Strategic Plan.
The College’s institutional goals for student achievement are determined relative to multiple sources of comparative data and to institutional aspirations, as stated in the College’s strategic plan. Because performance indicators for graduates’ achievements are specified in South Carolina law, the College of Charleston relies primarily on comparisons to other universities also assigned by the state to its “four-year colleges and universities” category. Further, because the College has been characterized by stable undergraduate enrollments and SAT/ACT scores for incoming undergraduate students, the College’s past performance is heavily weighted in determining appropriate criteria and thresholds of acceptability for undergraduate student achievement.
Goal 1: Four-Year and Six-Year Graduation Rates (S.C. Performance Indicator)
Institutional Goal: For students enrolling as degreeseeking undergraduates, the College’s strategic plan goal for the four-year graduation rate is 62% and the strategic goal for the College’s sixyear graduation rate is 73%. These goals are intended to increase the four- and six-year graduation rates thereby improving student success outcomes and positioning the College among the very best institutions in the state, region, and nation.
Minimum Threshold: According to the state of South Carolina, the College of Charleston is a public university in the state’s “fouryear college and university” category. The College of Charleston is one of only two universities in this category with a history of exceeding the College’s minimum four-year graduation rate threshold (50%) and the College’s minimum six=year graduation rate threshold (60%). The current threshold for undergraduate student achievement at the College of Charleston was selected because it is consistent with or exceeds the historic performance for students at universities in our statedesignated peer group. The minimum threshold also is consistent with the national average for Public Master’s I institutions, as reported by the South Carolina Commission on Higher Education.
Outcome: The College of Charleston has met or exceeded the minimum threshold for four-year graduation rate achievement in each year. The College of Charleston has met or exceeded the minimum threshold for six-year graduation rate achievement in each year. The College is making positive progress toward the goals established in the 2020 strategic plan for four-year and six-year graduation rates.
The College’s four-year graduation rate (Table 1) for the past several years has ranged between 52% and 62%. For example, based on the 2015 cohort, the four-year graduation rate for the College places the institution fourth among the 12 South Carolina institutions in the four-year college and university category with a four-year graduation rate of 59% and a six-year graduation rate of 67% (Figure 1). The College’s six-year graduation rate (Table 1) for the past several years has ranged between 64% and 71%. The six-year graduation rate for the College is fourth among the twelve South Carolina institutions in the four-year college and university category (Figure 1).
Table 2 presents additional data regarding four- and six-year graduation rates for entering cohort 2015 by race/ethnicity, gender, and socioeconomic status (Pell Grant recipients). The four-year graduation rate for all students is 59% and the six-year graduation rate is 67%. Graduation rates by sex, race/ethnicity, and socioeconomic status vary as summarized below:
- By gender, females’ six-year graduation rate is 70%, 9% higher than males (61%); females’ four-year graduation rate is 63%, 14% higher than males (49%).
- By race/ethnicity, White students’ six-year graduation rate is 67%, Black or African American 66%, Hispanic 60%, Asian 89%, Nonresident alien 65%, American Indian or Alaska Native 75%, Two or More Races 57%, Race Unknown 71%, and Native Hawaiian or Other Pacific Islander 100%.
- By race/ethnicity, White students’ four-year graduation rate is 60%, Black or African American 48%, Hispanic 50%, Asian 84%, Nonresident alien 53%, American Indian or Alaska Native 25%, Two or more Races 53%, Race Unknown 57%, and Native Hawaiian or Other Pacific Islander 100%.
- By socioeconomic status, Pell Grant recipients among entering cohort 2015 hold a four-year graduation rate of 52% and a six-year graduation rate of 62%.
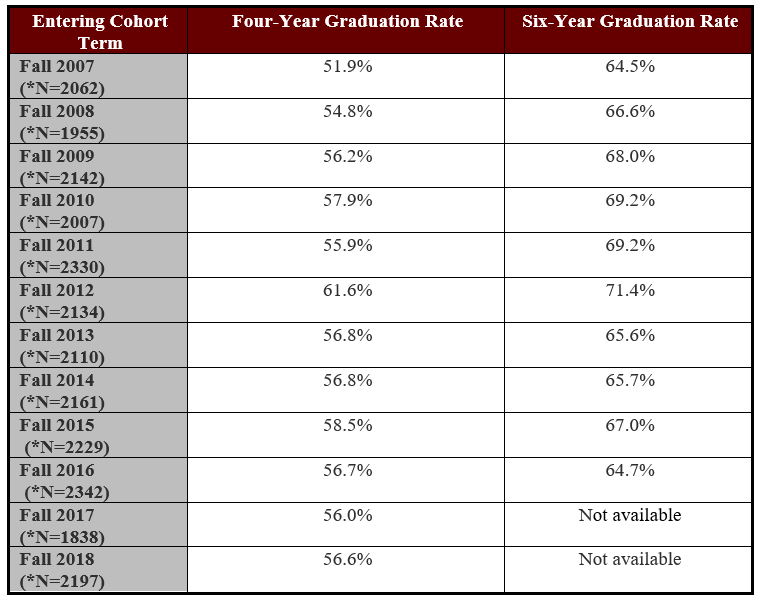
Note: The six-year graduation rates for entering cohorts Fall 2017 and Fall 2018 are not available yet and will be updated once data are available. *N represents the entering cohort’s enrollment population. Data source: Office of Institutional Research.
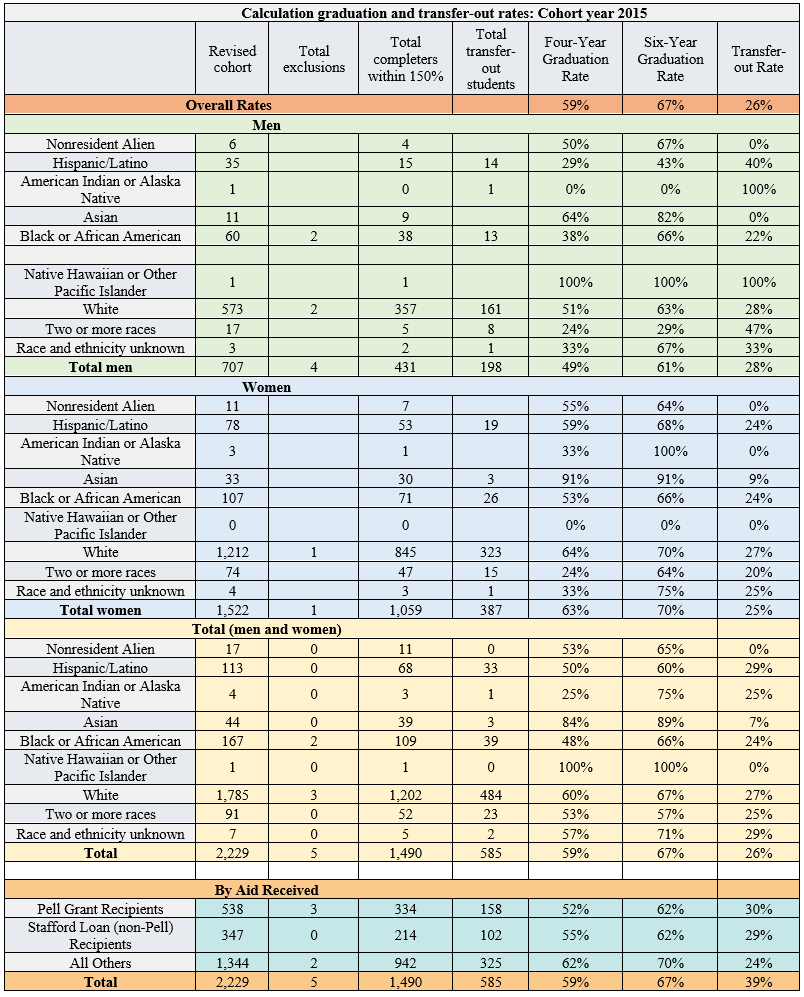
Note: 2015 represents Academic Year (AY) 2015-2016. Data source: 2021 IPEDS Graduation Rate Survey, Provided by the Office of Institutional Research.
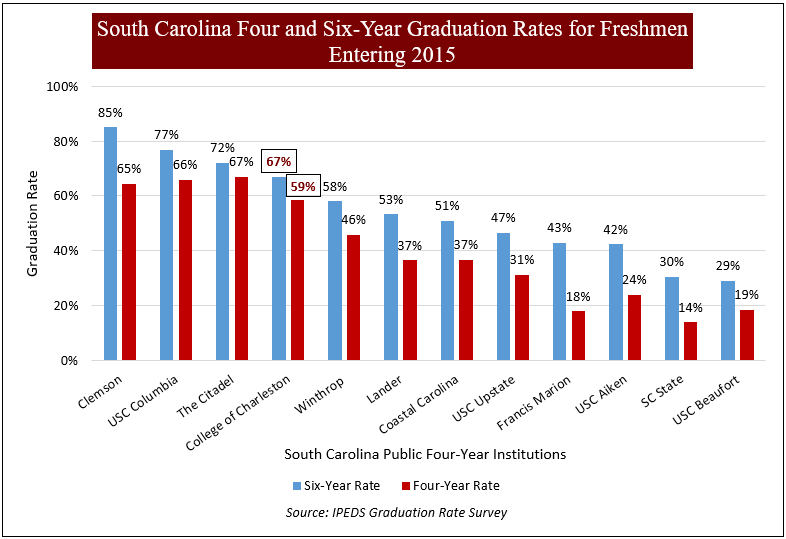
Note: 2015 represents Academic Year (AY) 2015-2016. Data source: 2022 South Carolina Commission on Higher Education 2022 Statistical Abstract.
Goal 2: Employment Rate for Graduates (S.C. Performance Indicator)
Institutional Goal: The College’s institutional goal is that at least 75% of new graduates of baccalaureate programs will be employed one year after graduation. This goal recognizes the importance of employment to the recent graduate and to the economy, while also acknowledging that graduates of a liberal arts and sciences university may elect to pursue graduate study, service, or experiences abroad immediately following graduation.
Minimum Threshold: The College of Charleston has long been described as a liberal arts and sciences university and many new liberal arts graduates of baccalaureate programs will choose to enroll in graduate and professional schools rather than seeking immediate employment. However, the College invests in career preparation for students and expects a minimum threshold of full-time employment for 60% new graduates.
Outcome: The College tracks job placement and graduate school attendance using the First Destination Undergraduate Survey (FDS) administered online to summer, fall, and spring graduates of the institution each year and represents employment and post-secondary education decisions after one-year of graduation. The survey includes questions about employment, additional education, and level of satisfaction with their experience at the College of Charleston. The Senior Exit Survey administered in May to the same cohort prior to FDS provides a baseline for students’ post-graduation plans.
As shown in Figure 2, data from the Senior Exit Survey indicates that the employment rate of graduating seniors ranged from 21% in Academic year 2015-16 to 46.7% most recently in AY 2020-21.
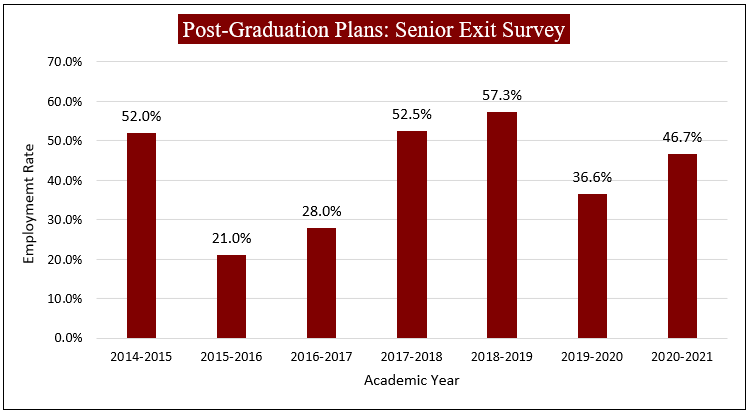
Note 1: The response rate and the total number of respondents over the years are 78% (N=1551) in 2014-15, 65% (N=1315) in 2015-16, 74% (N=1368) in 2016-17, 75% (N=1393) in 2017-18, 95% (N=1529) in 2018-19, 54% (N=768) in 2019-2020, and 49% (N=602) in 2020-2021. Employment category includes full-time, part-time, temporary or contract work, self-employed, multiple jobs, and military service.
Note 2: The drop of employment percentage in AY 2015-16 and AY 2016-17 was largely attributed to the changed employment category. Instead of specifying both “Employed full time” and “Employed part time” separately, the survey in these two years directly used “Employed,” It seems from the data survey respondents who held part-time jobs ignored this choice most likely. They probably reasoned employed includes military service and self-employment and does not include a part-time option. Data source: Senior Exit Survey, administered by the Office for Institutional Effectiveness.
Figure 3 shows data from the First Destination Undergraduate Survey administered to each graduating class, one year after graduation. The data indicates that the employment rate of graduates one year after graduation has increased from a low of 67% in 2018-2019 to 83% in AY 2020-21, surpassing the established minimum threshold of 60% and the institutional goal of 75%.
Figure 3: Employment Status One Year after Graduation
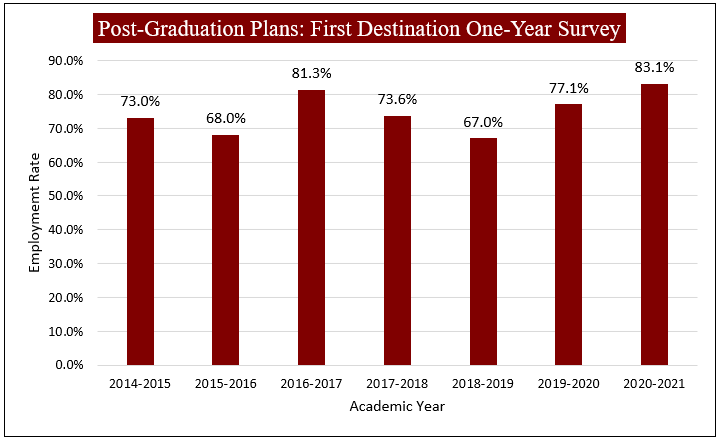
Note: The response rate and the total number of respondents over the years are 11.8% (N=257) in 2014-15, 20.0% (N=392) in 2015-16, 11.9% (N=252) in 2016-17, 9.0% (N=167) in 2017-18, 12.0% (N=252) in 2018-19, 8.2% (N=174) in 2019-20, and 12.4% (N=231) in 2020-2021. Employment category includes full-time, part-time, self-employed, multiple jobs and military service. Data source: First Destination Undergraduate Survey (One-Year) administered by the Office for Institutional Effectiveness.
Among the class of 2020-21 graduates completing the survey (N= 231), 71.6% report full-time employment within one year of receiving their degree, and 17.6% report being enrolled full time in a graduate or professional program. For those employed full time in one job, 45.5% found their job while still enrolled as an undergraduate, and 54.5% landed their job within the first six months after graduation.
There is a high degree of satisfaction among graduates with a single, full-time job. Graduates describe their employment as related to their undergraduate major (63%), using important skills they gained as an undergraduate (62%), meaningful (50%), and related to their desired career path (62%).
Goal 3: Number of Graduates Who Continued Their Education (S.C. Performance Indicator)
Institutional Goal: The College of Charleston has long been described as a liberal arts and sciences university, and survey reports reviewed at the College suggest that many new liberal arts graduates will immediately enroll in graduate and professional schools. Consequently, a significant number of new graduates will not be in the workforce one year after graduation because they are full-time students. Other new graduates will be simultaneously employed and enrolled as students. The College’s institutional goal is that at least 25% of new undergraduate degree recipients will be enrolled in a graduate, professional, or other educational program one year after graduation. This goal is related to Goal 2 (post-graduate employment) and is appropriate for the College since the overarching goal for new graduates is to be engaged in purposeful activity which may take the form of employment or additional education.
Minimum Threshold: In the interest of preparing high-achieving students, graduates should exhibit a pattern of admittance to graduate, professional, and other educational programs. The College of Charleston should see a minimum of 20% of first-time undergraduate degree recipients enrolled in a graduate, professional, or other educational program one year after graduation.
Outcome: The College tracks job placement and graduate school attendance using the First Destination Undergraduate Survey (FDS) administered online to summer, fall, and spring graduates of the institution each year and represents employment and post-secondary education decisions within the first six months of graduation, after one year, after three years, and after five years. They survey includes questions about employment, additional education, and level of satisfaction with their experience at the College of Charleston. The Senior Exit Survey administered in May to the same cohort prior to FDS provides a baseline for students’ post-graduation plans.
As shown in Figure 4, the percentage of graduating seniors who pursued a graduate, professional, and other educational program for the past seven academic years ranged from 14.0% in AY 2014-15 to 19.9% most recently in AY 2020-21. Given the robust employment rate of 83% for 2021 graduates (Goal 2, Figure 3), the College anticipates a possible lag in enrollment in graduate, professional, or other educational programs beyond one year following graduation.
Figure 4: Graduate Education Status Following Graduation
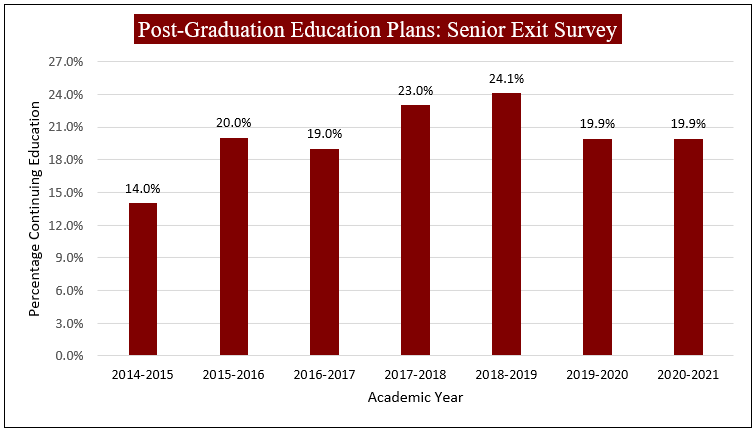
Note: The response rate and the total number of respondents over the years are 78% (N=1551) in 2014-15, 65% (N=1315) in 2015-16, 74% (N=1368) in 2016-17, 75% (N=1393) in 2017-18, 95% (N=1529) in 2018-19, 54% (N=768) in 2019-2020, and 49% (N=602) in 2020-2021. Data source: Senior Exit Survey administered by the Office for Institutional Effectiveness.
Figure 5 indicates that the percentage of new undergraduate degree recipients who enrolled in a graduate, professional, or other educational program one year after graduation for the past five academic years ranged from 17.9% in AY 2014-15 to 20.3% in AY 2020-21.
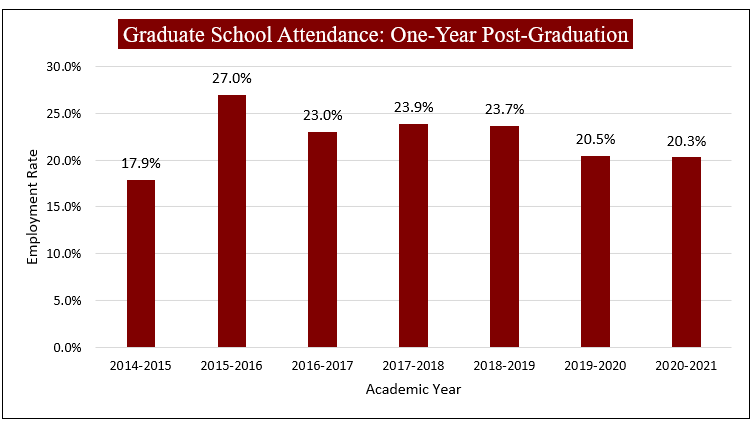
The response rate and the total number of respondents over the years are 11.8% (N=257) in 2014-15, 20.0% (N=392) in 2015-16, 11.9% (N=252) in 2016-17, 9.0% (N=167) in 2017-18, 12.0% (N=252) in 2018-19, 8.2% (N=174) in 2019-20, and 12.4% (N=231) in 2020-21. Data source: First Destination Undergraduate Survey (One-Year), administered by the Office for Institutional Effectiveness.
Among the Class of 2020-21 graduates completing the 2022 First Destination Undergraduate Survey one year after graduation (N=231), 17.57% of respondents were currently enrolled in a graduate program one year after graduation, and another 2.72% of respondents had already earned a master’s degree. Additionally, 55.1% of respondents reported that they hope to attain a master’s degree in the future.
Another indicator of successful preparation for graduate study is the number of College of Charleston graduates who earn a doctorate. Table 3 presents the additional data from the Survey of Earned Doctorates (SED), which indicates that 59 bachelor’s recipients who graduated from the College of Charleston received doctorate degrees in AY 2020, and 41 in AY 2021.
Table 3: The Number of Doctorates by Baccalaureate Institution from the Survey of Earned Doctorates (SED)
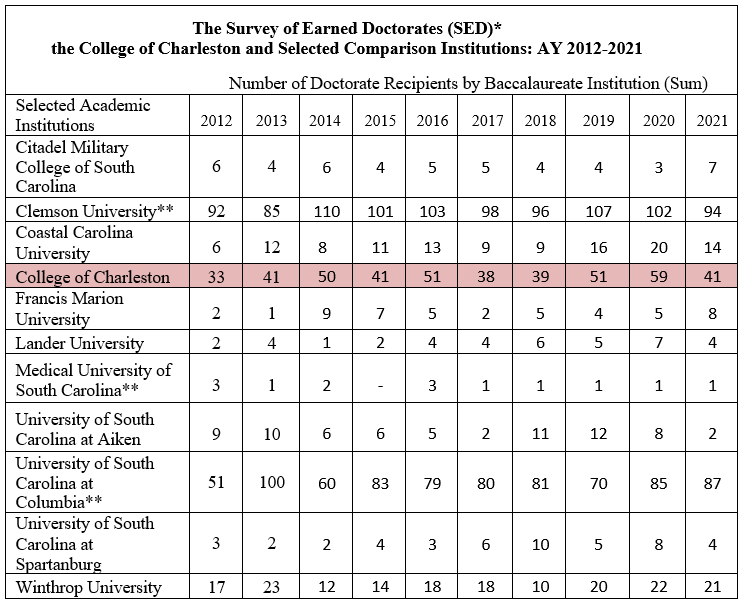
Note: *Professional degrees such as the M.D., D.D.S., O.D., D.V.M., and J.D. are not covered by the Survey of Earned Doctorates. **Denotes academic institutions that offer doctoral degrees. Source: National Center for Science and Engineering Statistics, Survey of Earned Doctorates. (https://ncsesdata.nsf.gov/).
Goal 4: Employer Feedback on Graduates (S.C. Performance Indicator)
Institutional Goal: When available, employer feedback will indicate a favorable assessment of the performance and/or preparation of College of Charleston students for workplace success. As a public liberal arts and sciences university, the College of Charleston strives to prepare student to succeed in a dynamic work environment. The same skills and aptitudes developed through a liberal arts and sciences curriculum are highly sought by employers and serve as markers of highly successful employees.
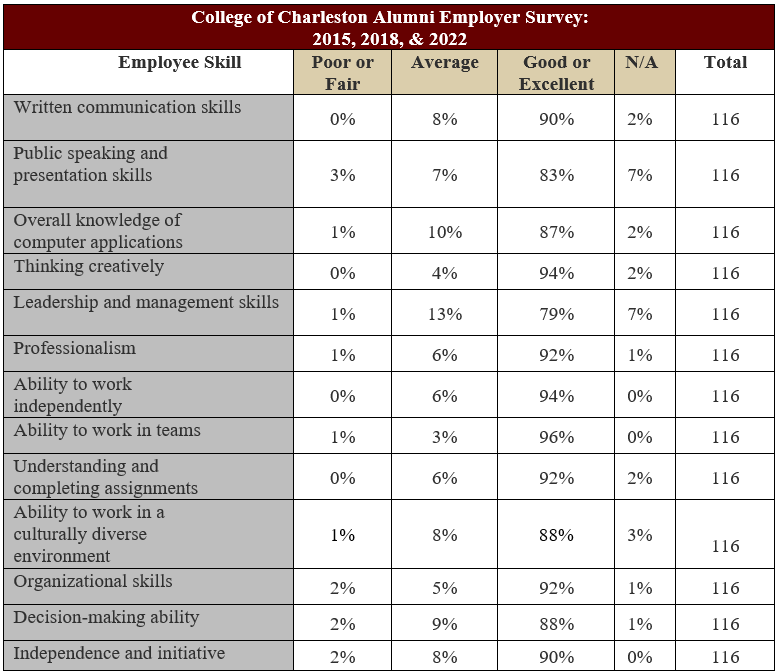
Minimum Threshold: The College administers an Alumni Employer Survey to current employers of College of Charleston alumni. The purpose of this survey is to understand whether alumni are obtaining the skills necessary for today’s workforce. Employers should rate a minimum of 75% of College of Charleston graduates as Good or Excellent on each of the 13 identified employee skills.
Outcome: As shown in Table 4, employers surveyed favorably rated the College’s graduates on a series of skills and abilities. Graduates exceeded the 75% threshold in all cases. Graduates were rated most highly on ability to work in teams (96% rated good or excellent), thinking creatively (94%), and ability to work independently (94%). Areas where scores were lower, but still exceed the 75% threshold for a good or excellent rating include public speaking and presentation skills (83%), and leadership and management skills (79%).
Table 4: The College of Charleston Alumni Employee’s Ability Level
Goal 5: Scores of Graduates on Post-undergraduate Examinations (S.C. Performance Indicator)
Institutional Goal: Advanced students or recent graduates who complete post-undergraduate examinations will earn scores consistent with or better than those earned by relevant peer groups, when peer data are available.
Minimum Threshold: Post-undergraduate examinations vary widely in their design, target population, and in the availability of comparison data from other institutions. The College’s institutional goal must allow for flexibility in identifying context-specific thresholds for appropriate achievement and populations of students. College of Charleston students should out-perform relevant peer groups on selected examinations by at least 5% in every category.
Outcome: The ETS Proficiency Profile was administered in the spring of 2021 to a sample of 305 seniors. As the results illustrate here, College of Charleston seniors scored higher in each skill dimension in comparison to students in the Carnegie Class who were tested. Students enrolled in teacher education programs matched or achieved higher pass-rates on the SC Praxis Traditional Assessment in three of six years by comparison to teacher education students statewide.
As shown below in Table 5, the ETS results showed seniors at the College of Charleston scored at least 6% or more than the Carnegie class in 2015, 2018 and 2021 in Reading level 1 (7% more than the Carnegie class in 2021, 11% in 2018 and 13% in 2015), Reading level 2 (6% more than Carnegie class in 2021 and 11% more in 2018 and 17% more in 2015), Writing level 1 (6% more than Carnegie class 2021, 15% more in 2018 and 15% more in 2015), Writing level 2 (7% more than the Carnegie class in 2021, 15% more than Carnegie class in 2018, 15% more in 2018 and 13% more in 2015), Mathematics level 1 (18% more than Carnegie class in 2021, 16% more in 2018 and 18% more in 2015), Mathematics level 2 (20% more than Carnegie class in 2021, 19% more in 2018 and 19% in 2015), and Mathematics level 3 (6% more than the Carnegie class in 2021, 8% more in 2018 and 6% more in 2015).
Table 5: ETS Proficiency Profile Results-Seniors-Percent Proficient (2021, 2018, 2015)
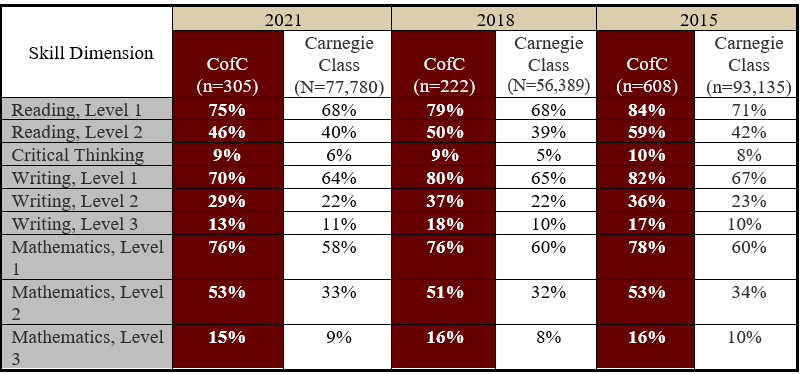
Note: 2015 represents Academic Year 2014-2015 since ETS test took place in Spring. Data source: Office for Institutional Effectiveness.
As shown in Table 6, the SC Praxis Traditional Assessment pass rates of students at the College of Charleston ranged from 84% (AY 2020-21) to 99% (AY 2015-16), 7% lower and 1% higher than the statewide average pass rates, respectively.
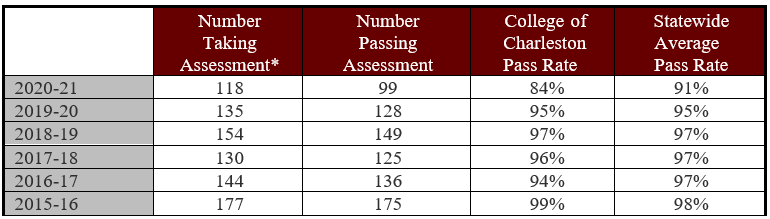
Note: *Number of completers taking one or more assessments within their area of specialization.
Goal 6: Credit Hours Earned of Graduates (S.C. Performance Indicator)
Institutional Goal: One state-designed indicator of graduate achievement concerns the College’s ability to minimize the number of undergraduate credit hours earned beyond the minimum credit hours required to earn a B.A. or B.S. degree. For students who entered the College of Charleston as freshmen, the College’s mean number of credit hours earned for a Bachelor of Science (B.S.) or Bachelor of Arts (B.A.) degree will not exceed 134 hours (i.e., 10% over and above the minimum 122 credit hours required to earn the degree). Note: Students earning double majors, second majors, or second degrees (including the A.B.) are excluded from measurements relevant to this goal.
Minimum Threshold: While students who change majors will sometimes earn credits beyond the 122-credit-hour minimum set by the faculty of the College, effective advising and prudent course selection should minimize the number of credit hours earned by graduates. A reduction in credits earned by those ultimately receiving B.A. and B.S. degrees might plausibly be assumed to lower student costs and time to graduation. For students entering the College as freshmen, the mean credit hours earned to complete a B.A. or B.S. should not exceed 134 credit hours.
Outcome: As shown in Table 7, for the past 10 academic years, the average credit hours of bachelor’s recipients with a B.A. degree from the College of Charleston was 128.25 with a standard deviation of 9.44, which was 5.75 credit hours lower than the cutoff credits of 134 hours. Similarly, the average credits hours of bachelor’s recipients with a B.S. degree from the College of Charleston was 132.25 with a standard deviation of 11.48, which was 1.75 credit hours lower than the cutoff credits of 134 hours.
Table 7: Average Credit Hours to Graduation
|
|
Students |
Hours Earned |
||
|
Average |
Standard Deviation |
|||
|
Yearly Totals - All Degrees |
1174 |
131.53 |
11.10 |
|
|
2012 |
||||
|
2013 |
1263 |
131.52 |
10.59 |
|
|
2014 |
1212 |
131.08 |
11.77 |
|
|
2015 |
1321 |
130.42 |
10.71 |
|
|
2016 |
1388 |
131.11 |
11.09 |
|
|
2017 |
1272 |
130.89 |
10.86 |
|
|
2018 |
1315 |
130.74 |
10.86 |
|
|
2019 |
1310 |
130.71 |
11.02 |
|
|
2020 |
1316 |
129.69 |
10.54 |
|
|
2021 |
1191 |
130.18 |
10.88 |
|
|
2022 |
1242 |
130.28 |
11.00 |
|
|
All |
14004 |
130.74 |
10.96 |
|
|
Degree Type |
Academic Year |
13 |
137.54 |
16.00 |
|
AB (Artium Baccalaureatus) |
2012 |
|||
|
2013 |
3 |
138.00 |
16.52 |
|
|
2014 |
12 |
141.08 |
11.54 |
|
|
2015 |
7 |
138.29 |
10.36 |
|
|
2016 |
8 |
141.25 |
13.50 |
|
|
2017 |
10 |
137.50 |
18.75 |
|
|
2018 |
8 |
138.38 |
13.81 |
|
|
2019 |
2 |
136.00 |
4.24 |
|
|
2020 |
4 |
156.00 |
7.53 |
|
|
2021 |
3 |
127.00 |
4.36 |
|
|
2022 |
3 |
144.67 |
18.93 |
|
|
Degree Total - All Years |
73 |
139.53 |
14.08 |
|
|
BA (Bachelor of Arts) |
|
484 |
128.83 |
9.71 |
|
2012 |
||||
|
2013 |
529 |
129.54 |
9.79 |
|
|
2014 |
483 |
128.71 |
9.84 |
|
|
2015 |
548 |
128.02 |
9.28 |
|
|
2016 |
525 |
127.87 |
9.39 |
|
|
2017 |
492 |
128.30 |
9.65 |
|
|
2018 |
479 |
128.22 |
9.60 |
|
|
2019 |
474 |
127.61 |
9.11 |
|
|
2020 |
490 |
126.97 |
7.98 |
|
|
2021 |
436 |
128.70 |
10.15 |
|
|
2022 |
494 |
127.96 |
9.08 |
|
|
Degree Total - All Years |
5434 |
128.25 |
9.44 |
|
|
BGS (Bachelor of General Studies) |
|
1 |
179.00 |
|
|
2020 |
||||
|
2021 |
11 |
136.00 |
18.17 |
|
|
2022 |
8 |
128.00 |
10.45 |
|
|
BPS (Bachelor of Professional Studies) |
Academic Year |
1 |
138.00 |
|
|
2017 |
||||
|
2018 |
1 |
122.00 |
|
|
|
2019 |
3 |
131.00 |
9.54 |
|
|
2020 |
1 |
123.00 |
|
|
|
2021 |
1 |
122.00 |
|
|
|
Degree Total - All Years |
7 |
128.29 |
8.22 |
|
|
BS (Bachelor of Science) |
|
677 |
133.34 |
11.52 |
|
2012 |
||||
|
2013 |
731 |
132.93 |
10.90 |
|
|
2014 |
717 |
132.52 |
12.63 |
|
|
2015 |
766 |
132.06 |
11.32 |
|
|
2016 |
855 |
133.01 |
11.53 |
|
|
2017 |
769 |
132.45 |
11.15 |
|
|
2018 |
827 |
132.13 |
11.25 |
|
|
2019 |
831 |
132.47 |
11.64 |
|
|
2020 |
820 |
131.13 |
11.27 |
|
|
2021 |
740 |
130.99 |
11.09 |
|
|
2022 |
737 |
131.80 |
11.84 |
|
|
Degree Total - All Years |
8470 |
132.25 |
11.48 |
|
Note: Counts include only students who entered the College as freshmen and exclude students graduating with more than one degree or major. Data source: Office of Institutional Research.
Goal 7: Undergraduate Retention Rates (College of Charleston Indicator)
Institutional Goal: As established in the College’s strategic plan, for students enrolling as degree-seeking undergraduates, the College’s first-to-second year retention of first-time, full-time freshmen will reach 87% by 2026.
Minimum Threshold: A review of institutional retention data over the last decade shows a relatively flat line with first-to-second year retention hovering around the 79% to 80% rate. In order for the College of Charleston to achieve its institutional goal of 87% by 2026, the institution should see a minimum of 1% increase in retention each year. Retention of first-time, first-year students is directly related to degree attainment and student achievement. The College is committed to continuous improvement in this area.
Outcome: As Figure 6 indicates, the College’s one-year retention rate of full-time freshmen was above 80% in 2012, went slightly below 80% until 2018 (81.1%), before returning to 0.1% below 80% in 2019, and finally back to above 80% in 2020 (82.5%). The most current one-year retention rate is 82.5% for students entering in Fall 2020. Since this is a metric is an essential element of the strategic plan, additional institutional effort and attention has been directed to retention as a significant metric of student achievement. A Student Success and Retention Steering Committee is working collaboratively with the strategic plan Pillar One Steering Committee guiding offices/departments across campus to better understand the institution’s retention data and to identify actions that will result in more students being retained. The global pandemic introduced new challenges in relation to increasing retention by 1% each year.
Figure 6: The College of Charleston One-Year Retention Rate from 2012 to 2020
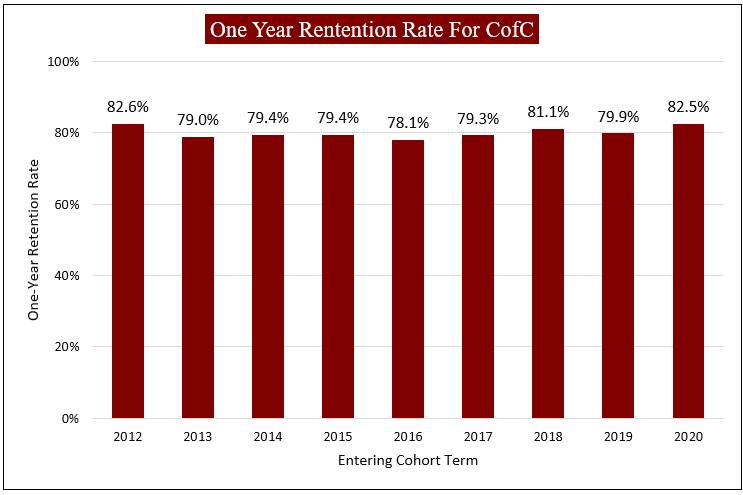
Data source: 2022 South Carolina Commission on Higher Education 2022 Statistical Abstract.
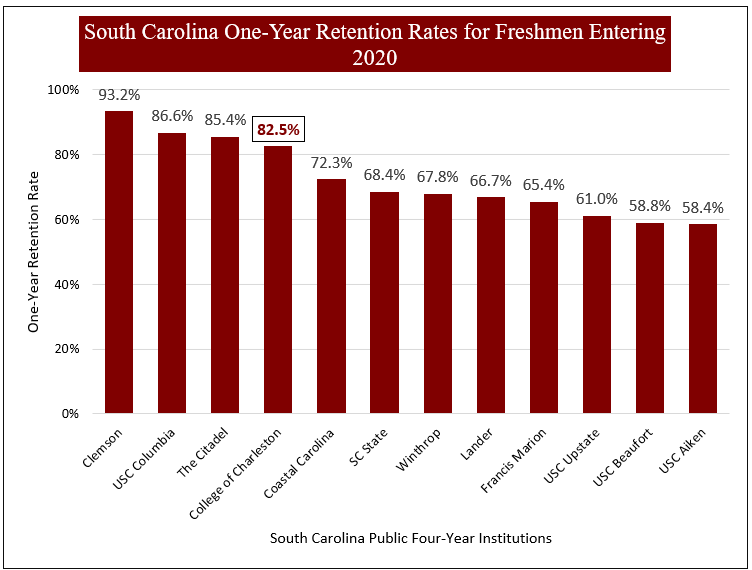
In terms of one-year retention rate by comparison to public peer institutions in South Carolina, based on the 2020 entering freshmen cohort, one-year retention rate of the College of Charleston (see Figure 7) was 82.5%, the fourth highest among South Carolina public universities and 2.9% lower than the Citadel (85.4%), 4.1% lower than University of South Carolina-Columbia (86.6%), 10.7% lower than Clemson University (93.2%). The College of Charleston continues to aggressively pursue higher retention rates for first-time students consistent with the institution’s commitment to continuous improvement and equity in student achievement for all students.
Goal 8: Degrees Awarded (College of Charleston Indicator)
Institutional Goal: The College of Charleston is working to increase the number of degrees awarded by 5% over the decade 2015-2025. This goal is highly correlated with the College’s ambitious retention and four-year graduation goals. The College undertook several steps beginning in 2019 to increase the size of the entering class (e.g., joined the Common Application, test-optional) which will yield more degrees awarded in future years.
Minimum Threshold: Between 2015 and 2025, the College of Charleston will increase the total number of undergraduate and graduate degrees awarded by 5%. The value of a college degree to the individual and society is well documented. The College’s goal and minimum threshold are intended to promote degree attainment.
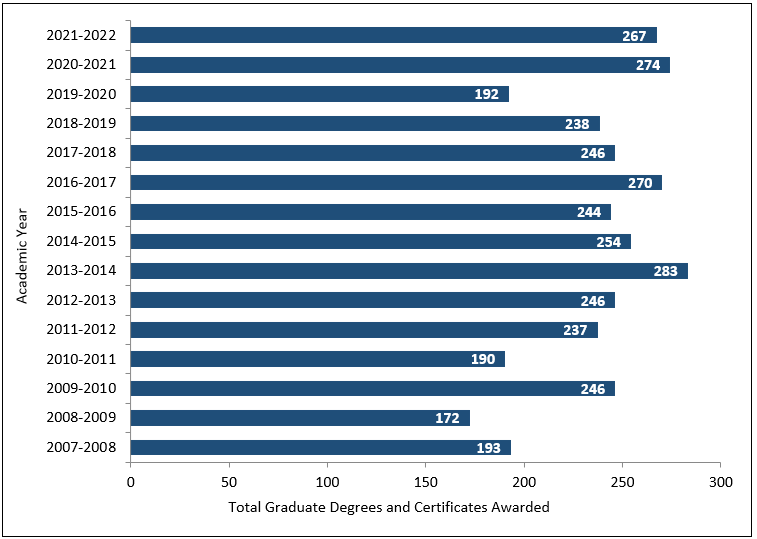
Outcome: The total number of undergraduate degrees and certificates awarded in AY 2021-22 was 2,143, which was 8.15% lower than the total in AY 2011-12 (total=2,333) (Figure 8). As for graduate degrees awarded by the College of Charleston (Figure 9), the total number of graduate degrees and certificates in AY 2021-22 was 267, which was 12.66% higher than the total in AY 2011-12 (total=237). Surpassing the minimum threshold for this metric is complicated by a decrease in the number of college-ready applicants and a decline in the traditional college-age population. Nationwide, higher education has experienced a 3.2% decline in total undergraduate and graduate enrollment since 2020. At the same time, the job market has been historically robust. The College of Charleston will continue to explore methods of recruiting a diverse population of undergraduate and graduate students going forward.
Figure 8: Total Undergraduate Degrees and Certificates Awarded by Academic Year (AY 2007-08 to AY 2021-2022)
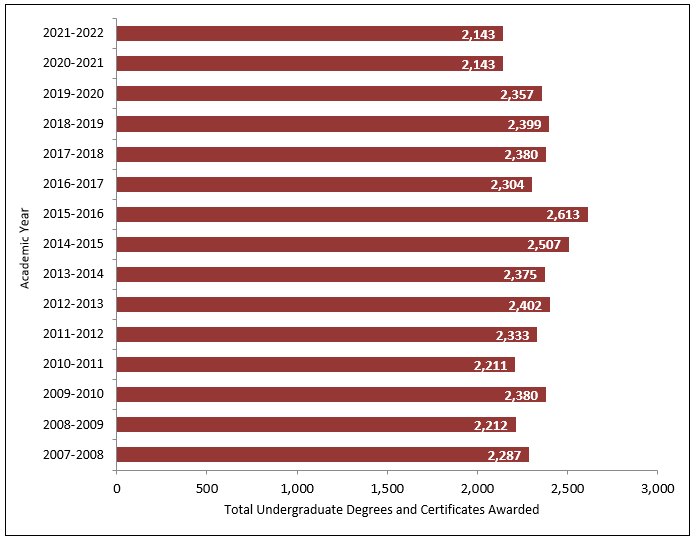
Note: In Figure 8 and Figure 9, 2008 represents AY 2007-08 as defined by IPEDS (the Integrated Postsecondary Education Data System). Data source: Office of Institutional Research.
Data source: Office of Institutional Research.
Goal 9: Time to Degree Completion (College of Charleston Indicator)
Institutional Goal: The published goal of the College of Charleston is to support students in pursuit of undergraduate and graduate degrees in ways that allow them to efficiently move through degree and academic program requirements.
Minimum Threshold: On average, undergraduate students should complete their degree in 4.2 years with a median attainment in 4 years for all students who enter the College as full-time, first-time students. Since graduate academic programs vary substantially in number of total credits, thesis and non-thesis, and summer enrollments, the College expects a majority of degree-seeking students to complete their program requirements in 2.4 years with a median attainment in two years for students enrolled full time. This minimum threshold recognizes the greater likelihood that master’s students are working full time and more likely to pause their programs of study.
Outcome: The average time to undergraduate degree completion at the College of Charleston since AY 2011-12 for all students who entering freshmen ranged from 4.23 in AY 2016-17 to 4.12 in AY 2021-22 (Table 8). The average time to undergraduate completion was most recently 4.12 years in AY 2021-22. The College supports students in achieving their degrees efficiently while maximizing their educational experience.
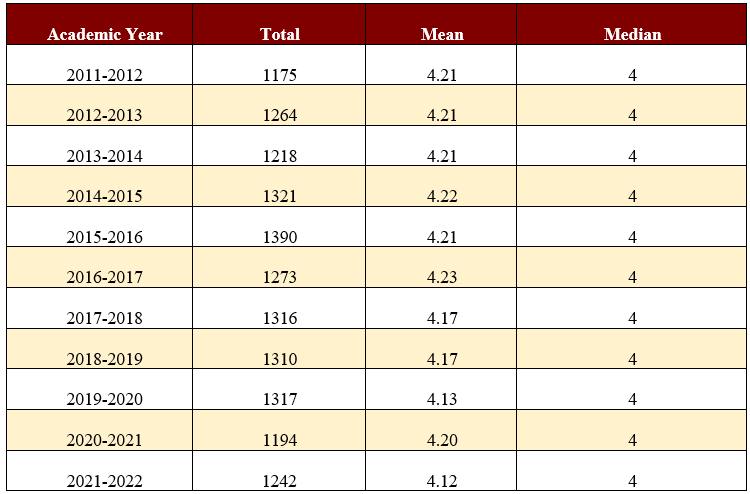
Note: The mean and median are calculated on years to graduation up to and including eight years.
Data Source: Office of Institutional Research.
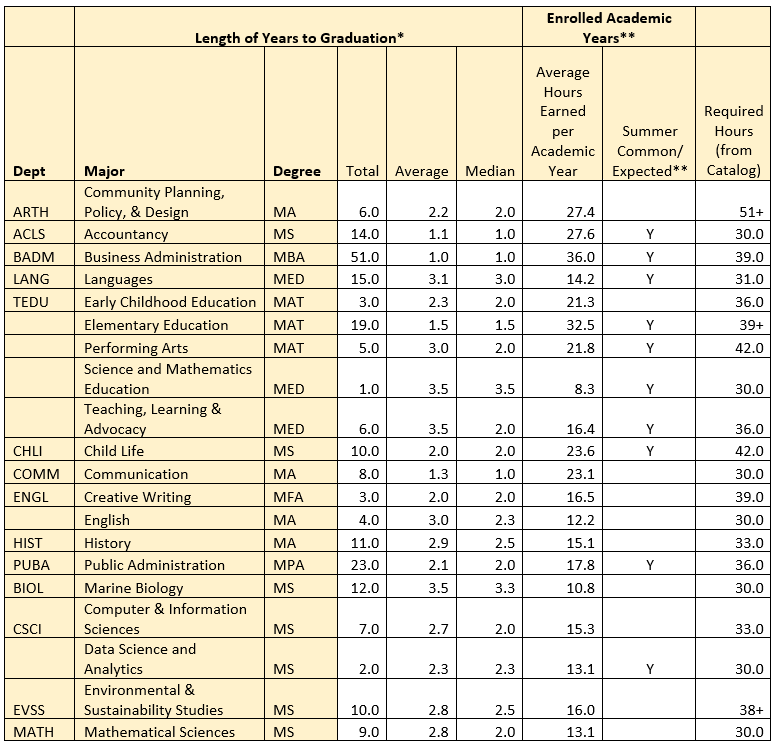
Note: *Calculation of years to graduation starts from the earliest date based on either the first term a student was admitted to a program or the first term in which the student began graduate coursework. **In programs where summer is common/expected, 1 full Enrolled Academic Year is measured as 40% fall, 40% spring and 20% summer. In programs where summer enrollments are not common, 1 full Enrolled Academic Year is measured as 50% fall and 50% spring. Also, note this table excludes students who earned more than one credential in the reporting year (e.g., a master's degree along with a certificate, or concurrent M.P.A./M.S.). Means and medians are calculated on years to graduation up to and including students who completed within eight years or earlier. Data Source: Office of Institutional Research.
The data presented in Table 9 (Length of Years to Graduation, Graduate Degree-Seeking Students), clearly shows the variation in years to completion by program. A majority of degree-seeking students graduate in two years or less. The MBA program, for example, is designed to be completed in one year including summer. All 51 candidates for the MBA completed their degrees within the one-year framework in 2021-22. Graduate students, like undergraduates, enjoy the support of academic program advisors and research mentors.
Goal 10: Course Completion Rates (College of Charleston Indicator)
The College of Charleston seeks to support undergraduate students in efficient degree completion by ensuring that they successfully complete each of their courses. By reducing the number of students receiving DFW grades, students should move through degree requirements and academic programs more efficiently. High quality advising, accurate course placement, and frequent feedback from faculty are some of the tools the institution relies upon to assist course completion. Course completion rates are highly correlated with retention and graduation rates; therefore, reducing the DFW rate is an institutional priority.
The Graduate School provides graduate students with high-quality curricula and course offerings supported by faculty mentoring and advising. Graduate students are expected to move through their program of study efficiently. The institution supports students matriculating full-time and part-time in recognition that they may be employed while enrolled.
Minimum Threshold: The College of Charleston should have undergraduate DFW (D grades-fail-withdrawal) rates at or below 15% for undergraduate course enrollments in an academic year. This threshold is appropriate because it allows faculty to maintain academic standards while identifying courses where additional support for student success may be indicated. Graduate student failure/withdrawal rates should not exceed 3%. This minimum threshold is appropriate relative to a wide variety of academic programs, all with high expectations for success and progression through master’s degree requirements. Grade C is the lowest “acceptable” grade for graduate students.
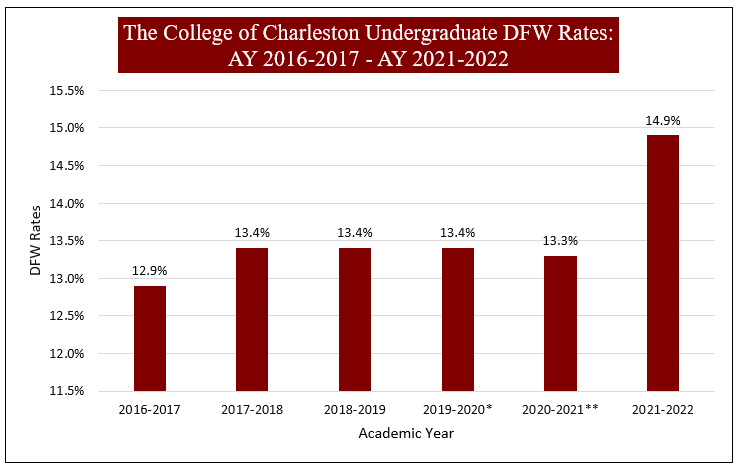
Outcome: For the past six academic years from AY 2016-17 to AY 2021-22, the undergraduate DFW rate has been below 15% (see Figure 10). The undergraduate DFW rate ranged from a low of 12.9% in AY 2016-17 to a high of 14.9% in AY 2021-22. The data shows that the College of Charleston is below the minimum threshold for DFW rates.
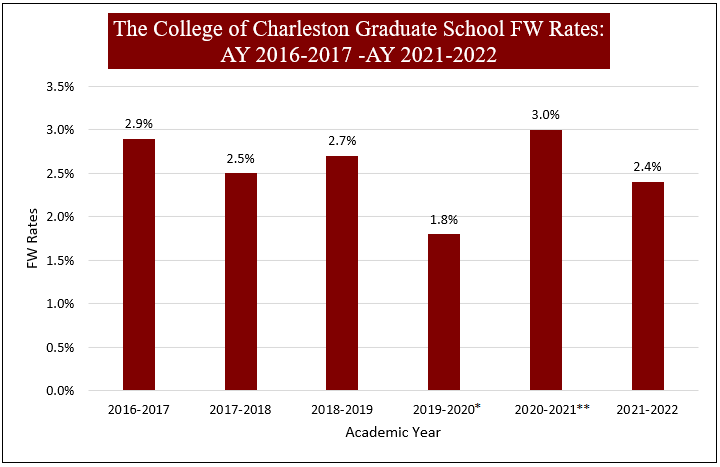
For the past six years from AY 2016-17 to AY 2021-22, the graduate failure/withdrawal dates have ranged from a low 1.8% in 2019-20 to a high of 2.9% in 2016-17. The most recent year, AY 2021-22, shows a 2.4% failure/withdrawal rate. In each year, the number and percent of students withdrawing from a course exceeds the number and percent of students failing a course.
Figure 10: The College of Charleston Undergraduate DFW Rates
Note 1: Grades given where quality hours do not contribute to a student's GPA are excluded from this report.
Note 2*: Due to the COVID-19 global pandemic, a new grade type was created in Spring 2020 to reflect the significant disruption students and faculty experienced. The significant disruption grade type included two values: PS (passing grade D- and above; credit earned without impact on the GPA) and NS (failing; no credit earned, no impact on the GPA). Faculty entered standard letter grades A-F based on student academic performance. Once grades were visible, a student could select PS/NS for one, some, or all of their eligible courses completed in Spring 2020 (not all courses were eligible, see policy). In addition, the withdrawal deadline (W) was extended until the last day of classes. As a result, the DFW rate is not comparable to other semesters in which only the standard letter grades A-F were allowed and the W deadline appearing on the academic calendar was enforced. Consequently, Spring 2020 DFW data is excluded from the above chart.
Note 3**: The significant disruption grade mode was available to students in Spring 2021 also, but limited to one eligible course grade only. The substitution of only one course grade did not significantly impact the overall DFW rate for that semester so those data are included.
Data source: Office of Institutional Research.
Note 1: Grades given where quality hours do not contribute to a student's GPA are excluded from this report
Note 2*: Due to the COVID-19 global pandemic, a new grade type was created in Spring 2020 to reflect the significant disruption students and faculty experienced. The significant disruption grade type included two values: PS (passing grade C and above; credit earned without impact on the GPA) and NS (failing; no credit earned, no impact on the GPA). Faculty entered standard letter grades A-F based on student academic performance. Once grades were visible, a student could select PS/NS for one, some, or all of their eligible courses completed in Spring 2020 (not all courses were eligible, see policy). In addition, the withdrawal deadline (W) was extended until the last day of classes. As a result, the FW rate is not comparable to other semesters in which only the standard letter grades A-F were allowed and the W deadline appearing on the academic calendar was enforced. Consequently, Spring 2020 FW data is excluded from the above chart.
Note 3**: The significant disruption grade mode was available to students in Spring 2021 also, but limited to one eligible course grade only. The substitution of only one course grade did not significantly impact the overall FW rate for that semester so those data are included.
Data source: Office of Institutional Research.